Discrete Share Price Performance (%)
12 months to end ofJun 2026Jun 2025Jun 2024Jun 2023Jun 2022
Edinburgh Investment Tst plc4.214.318.211.42.1
IT UK Equity Income13.415.810.23.2-5.6
FTSE All Share21.911.213.07.91.6
Net Asset Value6.010.019.013.41.6
Quartile Ranking43112
Source: FE fundinfo as at 03/07/2026. Performance figures are shown in GBX and in total return terms, with net dividends reinvested.
Cumulative Share Price Performance (%)
As at previous day end1 month3 months6 monthsYTD1 year3 years5 years10 yearsSince Inception
Edinburgh Investment Tst plc3.36.32.62.36.743.761.283.4796.5
IT UK Equity Income2.47.25.86.114.946.441.5106.7693.3
FTSE All Share3.34.09.09.223.355.868.7131.31010.2
Net Asset Value4.54.54.74.18.541.361.084.7362.2
Quartile Ranking23344224
Source: FE fundinfo as at 03/07/2026. Performance figures are shown in GBX and in total return terms, with net dividends reinvested.
Premium/Discount history
If a trust’s share price is higher than its net asset value (NAV) then it is said to be trading at a ‘premium’; if the share price is below the NAV then it is trading at a ‘discount’. A figure above 0 is a premium and one below 0 is a discount.
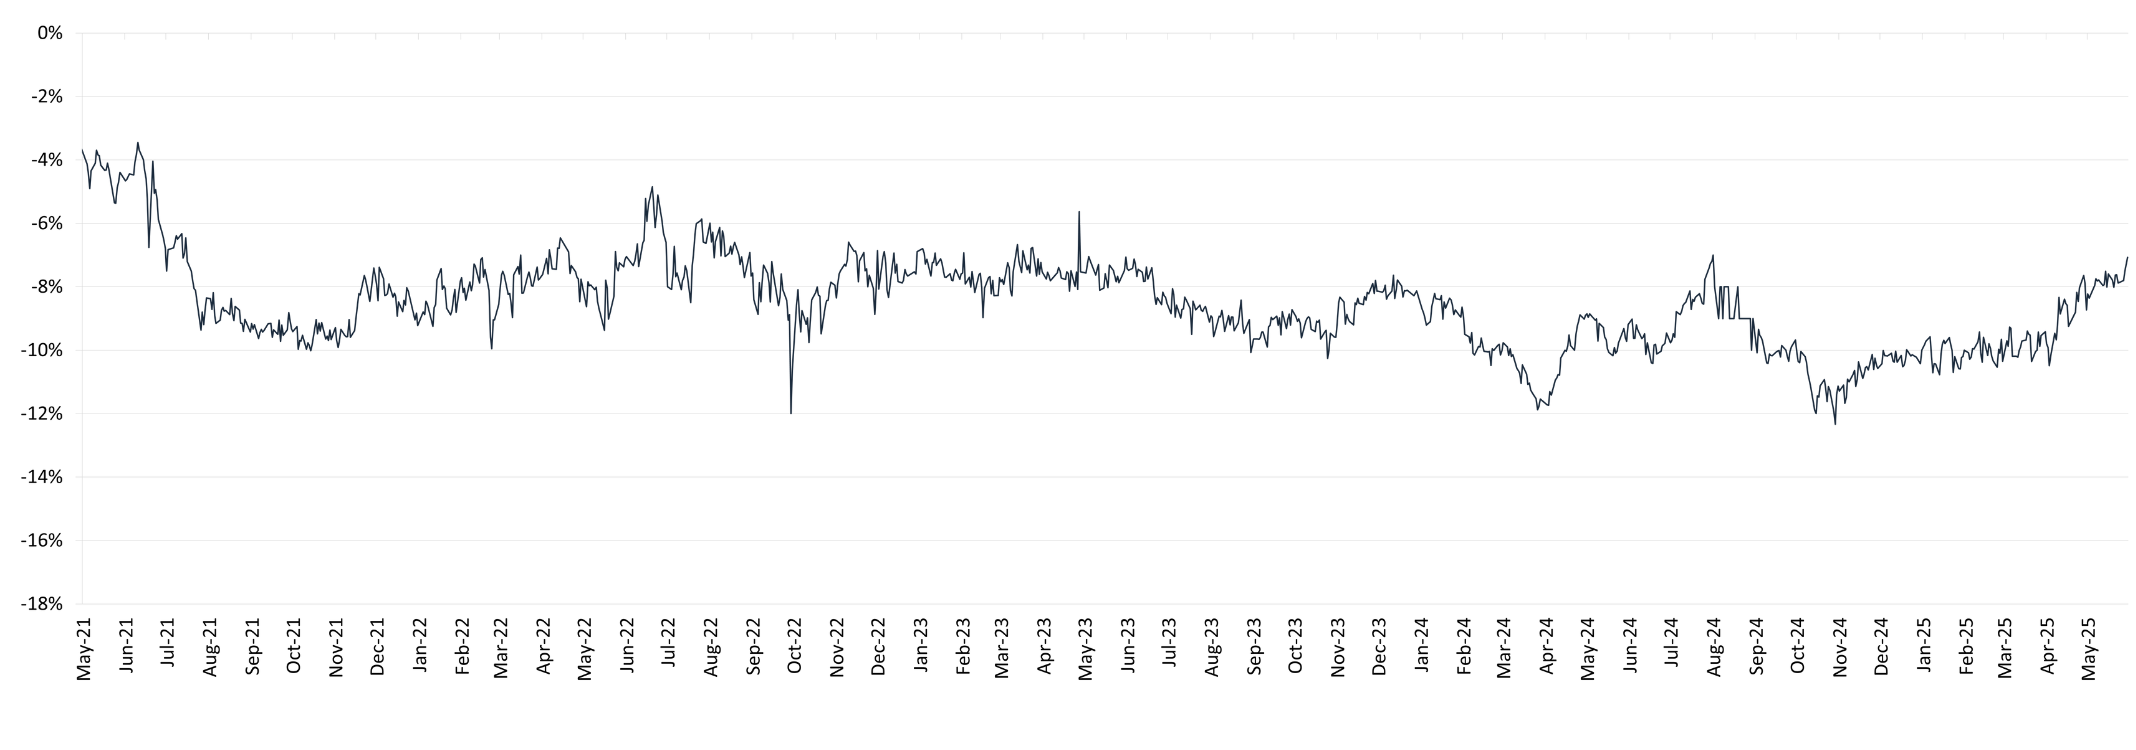
Source: Bloomberg as at 31/05/2026. Cumulative income net asset value (debt at fair value).